
China Top 10 IoT Devices for Energy Monitoring
China’s energy transition is creating a practical need for better visibility inside factories, offices, and homes. The International Energy Agency’s Energy Efficiency 2023 report notes that buildings account for about 30% of global final energy consumption. That figure makes small measurement gaps worth investigating. A high idle load, a compressor cycling too often, or a meter that misses peak demand can quietly raise costs.
This guide examines Iot Devices For Energy Monitoring available to Chinese buyers, from smart meters and power-quality analyzers to wireless sensors and gateways. It compares what each device measures, how readings are connected, and where installation or data compatibility may become difficult. The aim is useful selection, not a claim that one product suits every site. No device is perfect.
The International Energy Agency describes energy efficiency as “the first fuel,” a phrase used by its Executive Director, Dr. Fatih Birol. The idea fits monitoring: measured consumption can reveal opportunities, but sensors alone do not guarantee savings. The ten-device overview therefore focuses on specifications, deployment context, and limitations, while treating manufacturer claims cautiously. Buyers should verify local connectivity, electrical ratings, cybersecurity documentation, and integration requirements before installation. Those details matter on a noisy factory floor, where wireless signals may drop and readings can be misinterpreted. The ranking is a starting point, not a substitute for site testing.
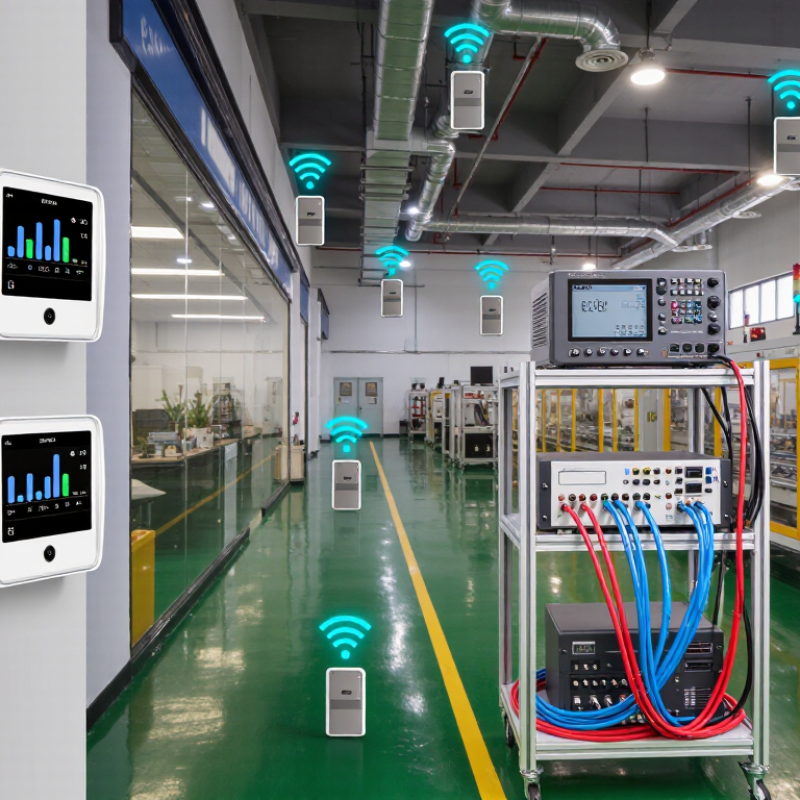
What IoT Energy Monitoring Devices Measure and How They Work
IoT energy monitoring devices turn electrical activity into readings that operators can inspect. Current sensors, often clamped around a wire, detect how much electricity flows without interrupting the circuit. Voltage measurements add context. Together, these values help calculate power in kilowatts and energy use in kilowatt-hours.
That distinction matters.
Some devices also record frequency, power factor, and voltage changes. These measurements can reveal an overloaded motor or an unusual load pattern. In a workshop, a sensor might show a compressor drawing more current during repeated starts.
Smart meters may measure whole-building consumption, while circuit-level monitors identify which areas use the most energy. Timing matters. Frequent samples can capture short peaks, but they also create more data to manage.
Readings travel through a local gateway or network connection to software for viewing and analysis. A dashboard might compare this week’s overnight use with last week’s, or send an alert when consumption rises unexpectedly. Yet a precise-looking chart is not automatically a precise measurement. Incorrect sensor placement, poor calibration, or missing data can distort the picture. Sensor placement deserves care. Operators should check readings against known equipment behavior and investigate surprising changes before treating them as confirmed faults.
China’s IoT Energy Monitoring Market and Device Categories
China Top 10 IoT Devices for Energy Monitoring
China’s IoT energy-monitoring market serves factories, commercial buildings, campuses, and infrastructure operators. Their needs differ: a production line may require equipment-level readings, while an office may focus on floor-by-floor consumption. Device selection depends on the measurement point, existing electrical systems, and how quickly staff need to act on unusual readings.
The main categories include smart electricity meters, power-quality analyzers, current sensors, temperature sensors, and communication gateways. Meters record energy use over time; analyzers can reveal voltage changes or phase imbalance. Current sensors can be fitted around cables, making them useful where rewiring is impractical. Gateways collect readings from multiple devices and send them to monitoring software. Small devices matter.
In practice, an installation might track a chiller’s power draw, a distribution panel’s temperature, and a workshop’s hourly load. The category boundaries are not always neat. A meter may offer basic power-quality data, while a gateway may perform limited local checks. Still, gaps remain. Poor sensor placement, inconsistent intervals, or weak network coverage can make precise-looking dashboards misleading. Reliable monitoring depends on installation checks, clear device specifications, and regular comparison with verified meter readings.
China’s Top 10 IoT Energy Monitoring Devices: Market Context
China’s electricity consumption by sector, 2023 (TWh)
Industry accounts for the largest share of electricity use, making it a major setting for IoT energy monitoring. Common device categories include smart meters, power meters, power-quality analyzers, smart circuit breakers, current sensors, and energy gateways. Sector figures are from China’s National Energy Administration; device categories are examples, not market rankings.
The Top 10 IoT Devices for Energy Monitoring in China
China Top 10 IoT Devices for Energy Monitoring
The Top 10 IoT Devices for Energy Monitoring in China
China’s monitoring needs span factories, office towers, apartment blocks, and distributed energy sites. The International Energy Agency estimates that buildings consume about 30% of global final energy. The scale matters. China’s National Energy Administration reported electricity consumption of about 9.85 trillion kWh in 2024. Monitoring devices can help operators locate waste, but only when readings are reliable and acted upon.
A practical top-ten shortlist includes smart electricity meters, circuit-level submeters, current sensors, power-quality analyzers, smart plugs, HVAC meters, building-control gateways, wireless temperature sensors, solar inverter monitors, and battery monitoring units. Together, they track consumption, voltage, equipment conditions, and on-site generation. IoT Analytics estimated 18.8 billion connected IoT devices worldwide at the end of 2024, reflecting the expanding infrastructure behind these systems. Yet more data does not automatically mean lower bills.
For a Chinese facility, match devices to the load: a submeter can reveal a production line’s overnight draw, while temperature sensors can flag uneven cooling across floors. Check measurement accuracy, communication stability, data access, and compatibility with existing meters before deployment. No shortlist is perfect. Older buildings may have cramped panels, patchy wireless coverage, or incomplete circuit records; those constraints can make installation slower than expected. Begin with a small area and compare device readings against utility-meter data.
China Top 10 IoT Devices for Energy Monitoring - The Top 10 IoT Devices for Energy Monitoring in China
| # | Device type | What it monitors | Typical measurement performance | Common connectivity | Typical use |
|---|---|---|---|---|---|
| 1 | Smart electricity meter | Voltage, current, active power, power factor, and cumulative energy | Meter accuracy class commonly 1 or 0.5S, depending on the meter and application | RS-485/Modbus, cellular, or other meter-network interfaces | Building incomers, factories, and utility or facility metering |
| 2 | Multi-circuit power monitor | Current and energy across multiple branch circuits; some models also measure voltage and power | Often specified around 1% to 2%; accuracy depends on the meter, current transformers, and installation | RS-485/Modbus, Ethernet, or wireless gateway | Distribution panels, tenant billing, and circuit-level energy tracking |
| 3 | Wireless split-core current sensor | AC current; some systems estimate power when paired with voltage or meter data | Current accuracy is model-dependent; confirm the sensor range and stated error in its datasheet | Sub-GHz wireless, LoRaWAN, or a proprietary radio link to a gateway | Retrofits where opening existing wiring is impractical |
| 4 | Power quality analyzer | Voltage, current, frequency, harmonics, power factor, and energy; advanced models record disturbances | Measurement and energy accuracy vary by instrument class and configuration | Ethernet, RS-485/Modbus, or data-logging interface | Industrial sites investigating energy quality and equipment loads |
| 5 | DIN-rail submeter | Electricity use for a defined machine, floor, tenant, or distribution branch | Common meter classes include 1 and 0.5S; select according to the required measurement purpose | RS-485/Modbus, pulse output, or wireless gateway | Commercial buildings, workshops, and equipment-level monitoring |
| 6 | Smart plug with energy measurement | Plug-load voltage, current, power, and accumulated energy | Accuracy is product-dependent and generally intended for monitoring rather than revenue metering | Wi-Fi, Zigbee, or Bluetooth through a compatible hub or network | Appliances, office equipment, and small plug-in loads |
| 7 | HVAC energy monitoring controller | HVAC electrical consumption, run time, operating status, and selected temperature data | Energy accuracy depends on its integrated meter or external metering inputs | BACnet, Modbus, Ethernet, or building-management gateway | Chillers, pumps, air-handling units, and building energy management |
| 8 | Thermal energy meter | Heat or cooling energy calculated from fluid flow and supply/return temperature difference | Performance depends on the flow sensor, temperature sensors, installation, and meter class | M-Bus, RS-485/Modbus, pulse output, or wireless interface | District heating, chilled-water systems, and thermal submetering |
| 9 | Gas meter with IoT pulse or digital interface | Gas volume or meter pulses, with consumption totals transmitted for monitoring | Depends on the underlying gas meter and its approved measurement specification | Pulse input, M-Bus, NB-IoT, or another cellular/wireless link | Commercial kitchens, campuses, and building gas-use tracking |
| 10 | Energy data gateway | Collects and forwards readings from meters and sensors; typically does not measure energy itself | Data quality depends on connected instruments, polling settings, and communications | RS-485/Modbus, Ethernet, Wi-Fi, or cellular backhaul | Aggregating site data for dashboards, alarms, and energy-management platforms |
Note: This is a category-based overview, not a manufacturer ranking. Specifications and communication options vary by model; verify the applicable datasheet and installation requirements before selection.
Energy Monitoring Applications in Homes, Buildings, and Industry
China Top 10 IoT Devices for Energy Monitoring
In Chinese homes, smart meters and circuit-level monitors show when heating, cooling, or cooking drives electricity use. Room sensors add context: a warm, empty bedroom may signal wasted heating. Small signals matter. The International Energy Agency’s Buildings 2023 report says buildings account for about 30% of global energy consumption and 26% of energy-related emissions. These figures make accurate, timely measurement useful, not merely convenient.
In commercial buildings, submeters can separate consumption by floor, tenant, or system. Temperature, occupancy, and equipment sensors help operators compare HVAC demand with actual use. A morning load spike becomes easier to investigate when the data includes room conditions and operating schedules. Yet dashboards can mislead. A missing sensor or poorly placed meter may make a tidy chart look convincing.
Factories need a different level of detail. Networked power meters can track production lines, while current and temperature sensors help reveal inefficient motors or compressed-air equipment. The IEA’s Energy Efficiency 2023 report places industry at nearly 40% of global energy consumption. That scale makes reliable readings valuable, but devices alone do not deliver savings. Teams still need to check calibration, match energy data to production, and investigate unexplained changes. Not every spike has a neat explanation.
How to Choose an IoT Device for Energy Monitoring
Choosing an IoT energy-monitoring device starts with the question it must answer: whole-building trends, machine-level loads, or tenant usage. Start at the panel. The IEA’s Energy Efficiency 2023 report estimates that buildings use about 30% of global final energy. The IEA’s Electricity 2024 report projects global electricity demand will grow by an average of 3.4% annually from 2024 to 2026. Those figures make useful monitoring important, but they do not tell you which meter fits your site.
Check the electrical system before comparing dashboards. Confirm single- or three-phase service, voltage, current range, and whether clamp-on sensors fit the panel safely. Review accuracy at low loads, not only at full capacity. A device that misses overnight standby power can distort savings estimates. For factories, verify that its communication protocols work with existing controls. For distributed sites, check whether it stores readings during network outages.
Look for clear sampling intervals, exportable data, and role-based access. These details matter when staff need to compare a machine’s 15-minute load profile with a monthly bill. In China, confirm local technical support and compatibility with the site’s network setup. A polished dashboard can still hide gaps. Ask for a trial on one circuit, then compare its readings with a calibrated reference meter. That extra check takes time, and it may reveal that the original monitoring plan needs revision.
